How to get Canadian Forecasting Data
December 20, 2022
Chris Foster
CTO
Avvai Ketheeswaran
Software Developer
Beacon, one of the products we're building at Path and Focus, requires access to weather forecast information for all of Canada. Accessing and parsing forecasting data was challenging, but we were able to come up with a way to process forecast data files in GRIB2 format from the Meteorological Service of Canada (MSC)'s data service.
This blog post will dive into that process and hopefully can be useful if you're a Javascript developer interested in accessing and using public Canadian forecasting data. We will touch upon:
- using MSC Datamart services
- using GRIB2 output from the High Resolution Deterministic Prediction System (HRDPS)
- using Python to parse GRIB2 and connecting it with our core Node.js GraphQL API
MSC provides raw weather, water, climate, and environmental data for public use — see here for a complete list.
HRDPS GRIB2 data
We were specifically interested in accessing numerical forecasting data for British Columbia, namely temperature, relative humidity, precipitation, and wind speed. MSC provides various formats and different prediction models that vary in terms of how far in the future the data is predicted for, geographic location, and resolution.
Of the models that MSC provides, the High Resolution Deterministic Prediction System (HRDPS) data, which covers the majority of North America, was what we ended up using due to it having the highest resolution (2.5km), covers all of BC (the province that we're currently interested in), and provides a 48-hour forecast. The HRDPS has varying domains (ex. East, Prairies, West). We used the Continental domain grid as it covered all of BC (and a big chunk of North America).
For weather data that forecasts further out into the future, another model that might also be useful is the Regional Deterministic Prediction System which provides forecasts 84 hours in the future, however the resolution of the data is 10km.
HRDPS data (along with much of MSC's prediction data) comes in GRIB2 format. Since our existing core API was already in Javascript, we initially looked for NPM packages that could help us parse these files. After exploring some NPM packages (ie. grib2Json, vgrib), we found that none of them could parse the intricacies of the GRIB2 file format used by MSC. We did find GDAL bindings that would work with Node.js and could parse GRIB2 that way, but it would have required each of our developers to custom compile GDAL on their machine. We instead found several Python packages which parsed these files successfully. We settled on implementing a Python microservice which could parse GRIB2 files at request of our core API. Depending on your tech stack, something else might make more sense for your individual use case.
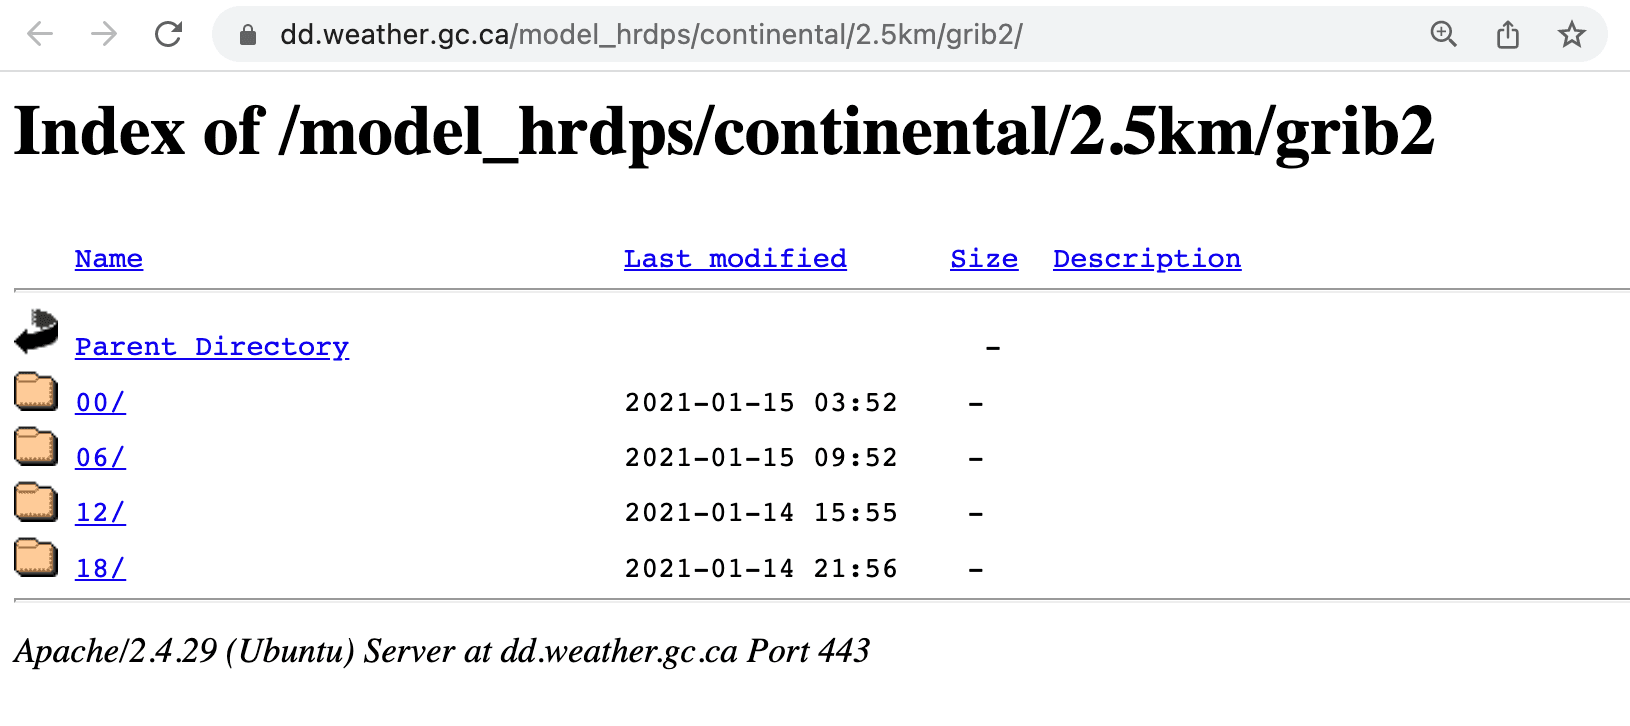
Before moving on to how we parsed it, it might be useful to understand how HRDPS files are organized in Datamart. The HRDPS model runs every 6 hours, so Datamart has directories for 00, 06, 12, and 18 hours UTC.
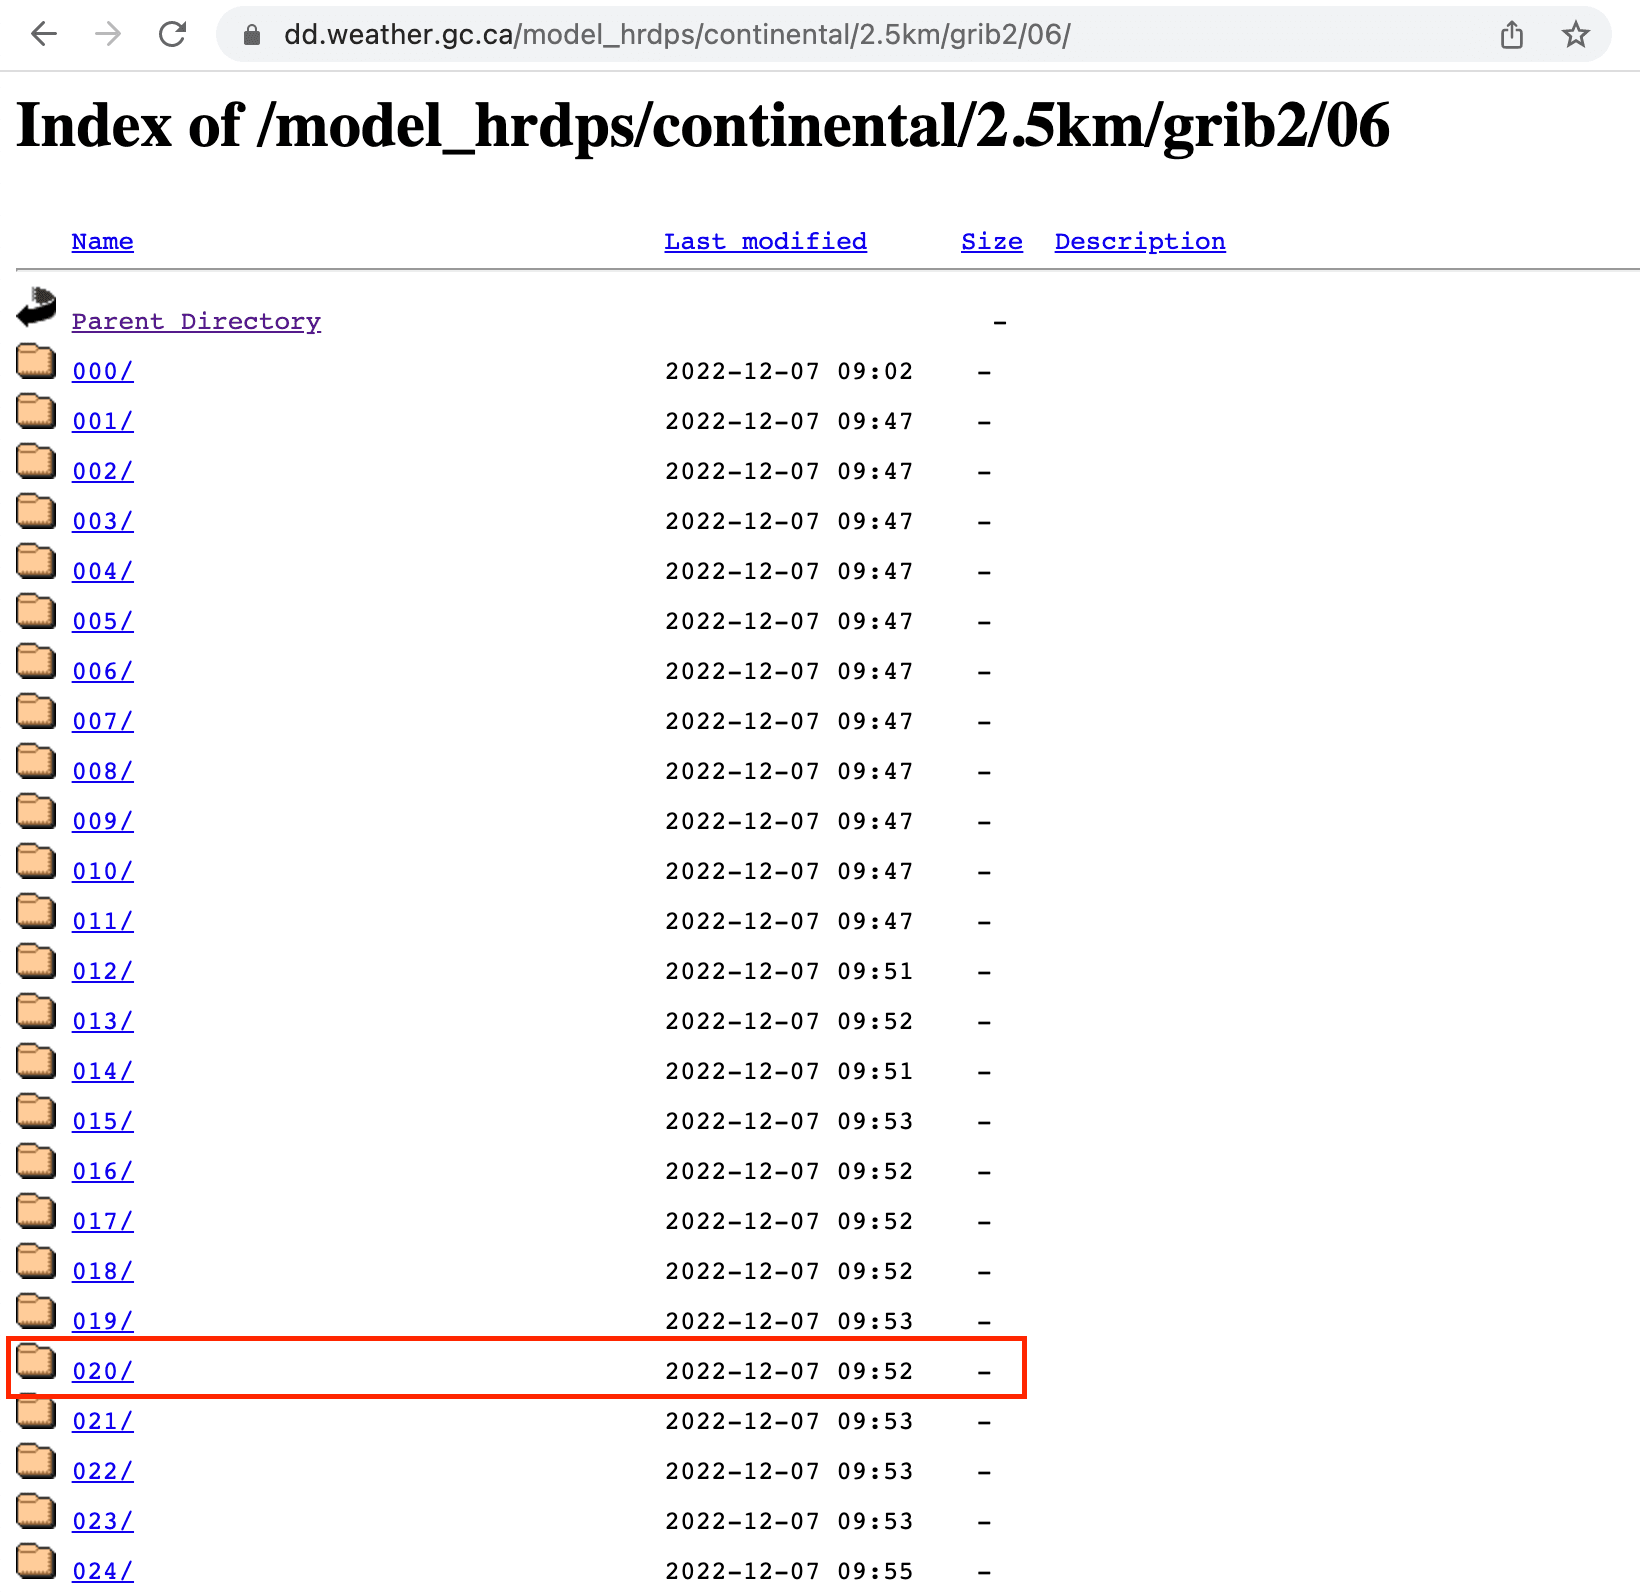
Within these directories, there is a collection of GRIB2 files for every hour up to 48 hours from the model run time. For example, if you are interested in the forecast for tomorrow at 2:00 am UTC (7:00 pm PT today), you can check a forecast that was run at 06:00 UTC for 20 hours in the future by selecting the 020 directory.
Within each of the hourly directories, there is one file for each weather variable. The variables are displayed in the file name.
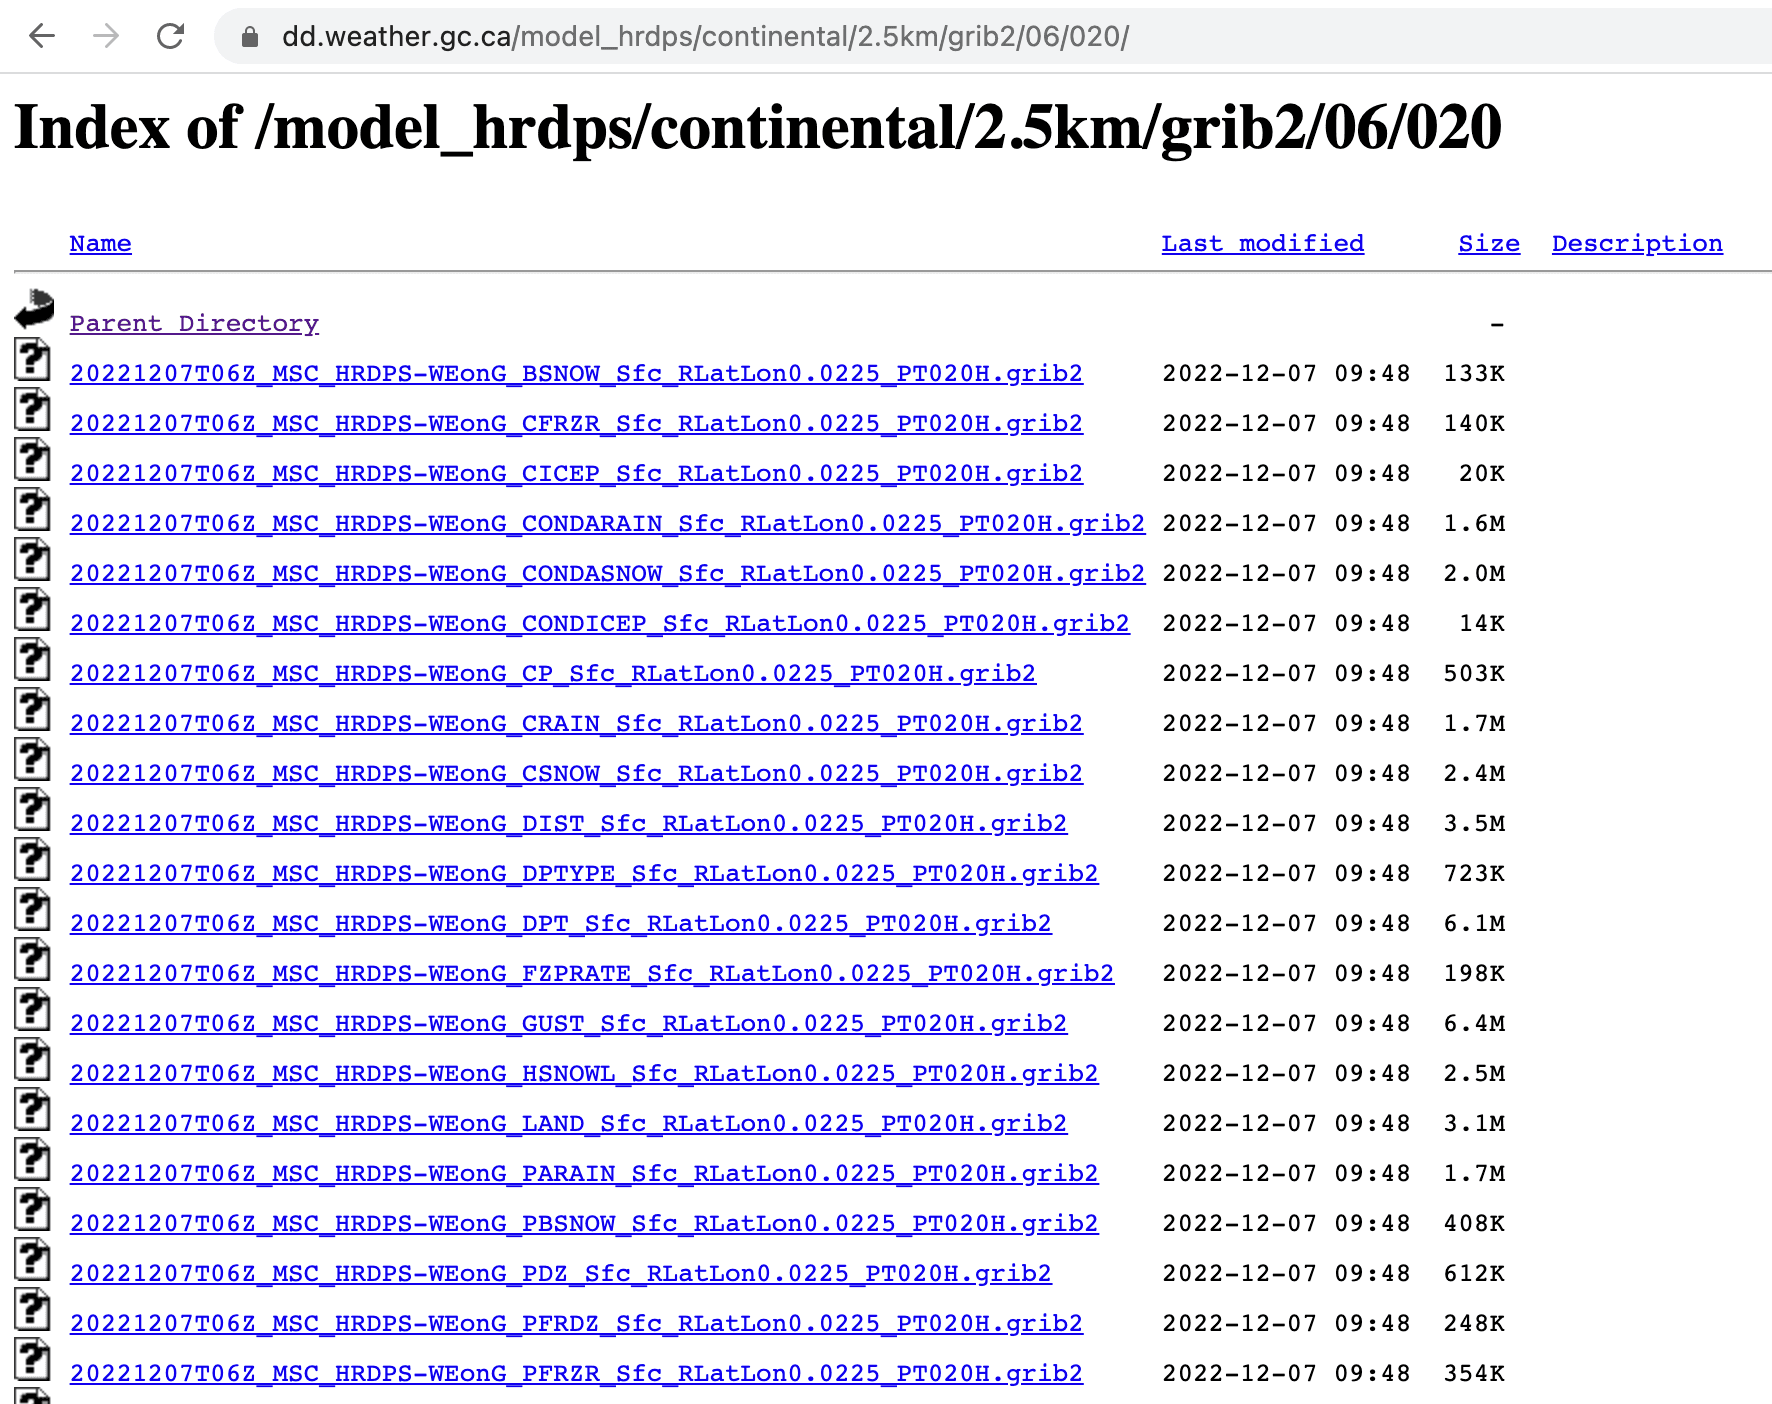
For a list of variables in the HRDPS model, this variable table may be useful. While it is slightly out of date with the current files, it may help point you in the right direction for what particular GRIB2 file to check out. In our case, the variables we were interested in were:
- Relative Humidity: RH_AGL-2m
- Wind Speed: WIND_AGL-10m
- Temperature: TMP_AGL-2m
- 24-hour precipitation: APCP_SFC
For some variables, it's important to know what vertical level the data is being forecasted at. For example, we chose a wind speed forecast that was 10m above surface level.
Once we narrowed down the variables we needed and determined how to interpret the folder structure, we were able to start collecting and parsing the data.
Parsing GRIB2 files
We started with setting up the Python microservice. The goal was to deploy this separately and query our core API, which is written in Javascript. For each request, the Python endpoint requires the URL of the GRIB2 file, the attribute that we're interested in (ex. air temperature) and the location that we want a weather value for. The specific attribute values will be explained below.
The request from our core API:
{

  "url": "https://example.com/test.grib2",
  "attribute": "t2m",
  "queries": [
    {
      "id": "62678264bacbdc4d1b37727b",
      "lat": 47.946352,
      "lon": -40.793874
    }
  ]
}
The response from the Python microservice:
{

  "url": "https://example.com/test.grib2",
  "attribute": "t2m",
  "queries": [
    {
      "id": "62678264bacbdc4d1b37727b",
      "lat": 47.946352,
      "lon": -40.793874
    }
  ]
}
We chose to use the Xarray Python package to open the GRIB2 file as it is a helpful tool to read multidimensional arrays such as GRIB files. For Xarray to read GRIB2 files it also needs the cfgrib package (Xarray provides a general tutorial for this process) and you must have ecCodes installed on your machine.
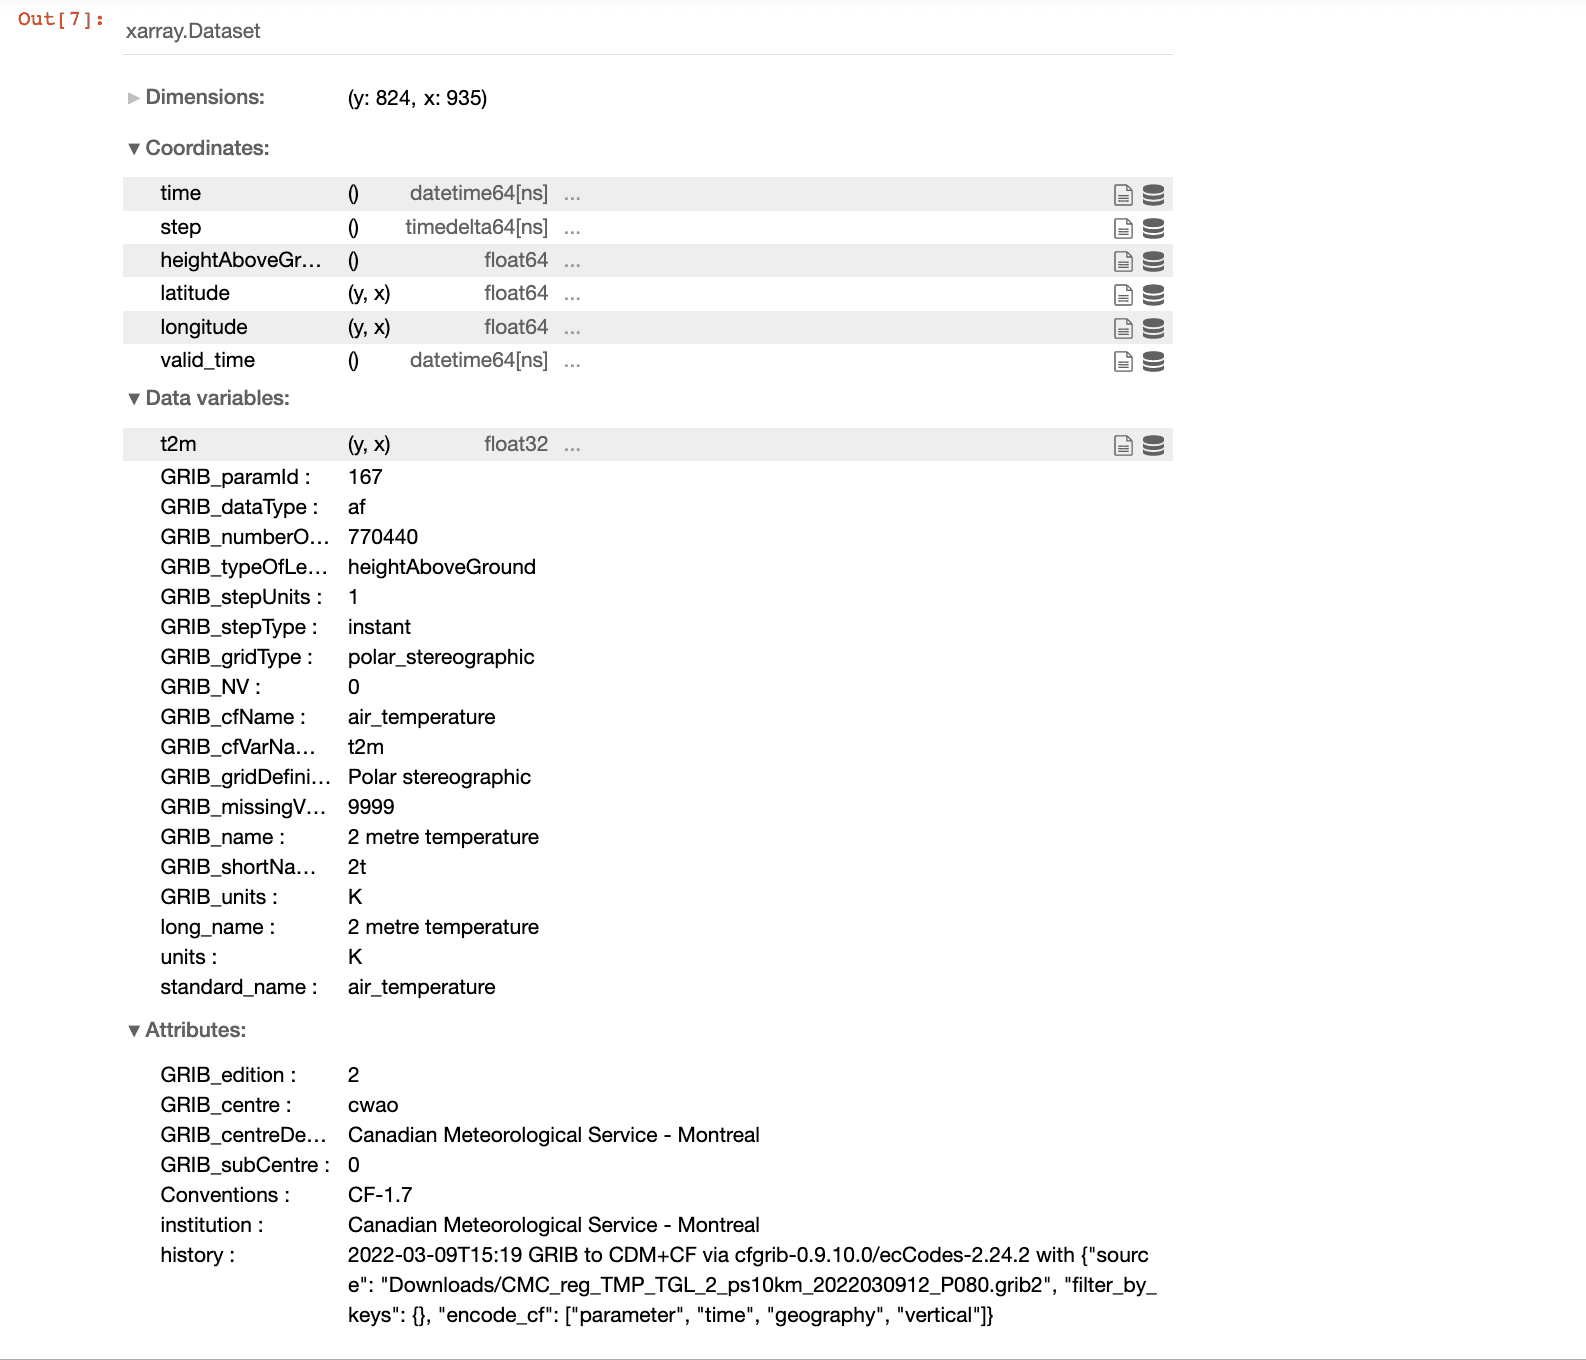
For each weather type, the data variable will differ. For example, in the file above for air temperature (TMP_AGL-2m in Datamart) the data variable is called t2m. For relative humidity (RH_AGL-2m in Datamart) the variable is called r2. The data in the GRIB2 file span all across the continent, so to get a specific forecast value, you must query a coordinate (lat, long) location that you are interested in.
Building the GRIB API Python server
We used Flask to build our microservice. If you're familiar with Node, Flask is similar to Express. A basic Flask application scaffold looks like this:
from flask import Flask, request

# create the Flask app
app = Flask(__name__)

# add the route() decorator to tell Flask what URL should trigger the parse function
# in this app, a POST request is needed, so that needs to be specified in the method argument
@app.route('/parse', methods=['POST'])
def parse():
   pass
The next step was to write the parse route handler. It is responsible for downloading an HRDPS file and calling our parsing logic.
import shutil
import tempfile
import xarray as xr
import urllib.request
import pandas as pd

def parse():
    # Pull out the different attributes in the request object
    url = request.json['url']
    attribute = request.json['attribute']
    queries = request.json['queries']

    # Copy the HRDPS file to a generated temporary file
    with tempfile.NamedTemporaryFile() as tmpFile:
        with urllib.request.urlopen(request.json['url']) as response:
            shutil.copyfileobj(response, tmpFile)
            tmpFile.flush()

        # Using Xarray and the cgfrib engine, open the HRDPS file and transform it to a 2D pandas dataframe
        with xr.open_dataset(tmpFile.name, engine='cfgrib',
                             backend_kwargs={'indexpath': ''}) as ds:
            hrdps = ds.to_dataframe()

        time = hrdps['time'].iloc[0]
        step = hrdps['step'].iloc[0]
        model_date = time.isoformat() + 'Z'
        forecast_date = (time + step).isoformat() + 'Z'

        # Query the dataset with a function that takes in the HRDPS data table, the lat & long, and the weather attribute specific to the file
        results = query_hrdps(hrdps, queries, attribute)

    # Return a response object
    return {
        'url': url,
        'forecastDate': forecast_date,
        'modelDate': model_date,
        'attribute': attribute,
        'results': results
    }
The query_hrdps function finds and returns the nearest HRDPS value for a given attribute for each query.
In this case, it takes in the hrdps data frame that was created above. It takes in the query parameters in the POST request and the attribute that we care about. In the file above the attribute is t2m but may differ based on what type of weather data you are interested in.
Let's take a look at the query_hrdps function. We use a cdist function to help calculate the distance between two pairs of latitudes and longitudes. This is necessary as the latitude and longitude we put in the request object may not exist in the data file. To find a weather value for that location, the best approximate is to find the closest data point to the provided query point.
from scipy.spatial.distance import cdist

def query_hrdps(hrdps, queries, attribute):

    queries = pd.DataFrame.from_records(queries)

    # Returns an array of distances ex. array([[259.61743934, 259.66974122, ..., 390.64931468, 390.62771646]])
    dists = cdist(queries[['lat', 'lon']], hrdps[['latitude', 'longitude']])

    # argmin() finds the index of the shortest distance, then returns a t2m value for the corresponding location
    queries['value'] = [hrdps[attribute].iloc[x.argmin()] for x in dists]

    # Returns a key value pair. ex: [{'value': 277.6233}]
    return queries[['value']].to_dict(orient='records')
And now we have our microservice!
Collecting GRIB2 files
To retrieve new forecasts in real-time, MSC has set up an Advanced Messaging Queuing Protocol (AMQP) server so that the application you are building can subscribe to new events. These events are notification objects containing a URL from which the new files can be requested. The developer can target notifications for a specific set of files based on their needs. MSC provides some docs on AMQP to help get started. We utilized the amqplib npm library to set up a connection on our core API.
This is a general guide of how we set up AMQP, fetching temperature forecasts as an example:
import amqplib from 'amqplib'

const AMQP_URL = 'amqps://anonymous:anonymous@dd.weather.gc.ca/?heartbeat=60'
const EXCHANGE = 'xpublic'

const EXPIRES = {{YOUR_EXPIRATION_TIMEOUT}}
const QUEUE_NAME = {{YOUR_QUEUE_NAME}} # See https://eccc-msc.github.io/open-data/msc-datamart/amqp_en/
const PYTHON_API = {{YOUR_PYTHON_API}}

async function start() {
  const con = await amqplib.connect(AMQP_URL)
  const ch = await con.createChannel()

	// Here we bind the exchange to the queue.
	// The exchange will relay messages to the queue according to the pattern given.
	// In this case, we want messages when there are new events to the hrdps continental directory.
	await ch.assertQueue(QUEUE_NAME, { expires: EXPIRES })
	await ch.bindQueue(QUEUE_NAME, EXCHANGE, 'v02.post.model_hrdps.continental.#TMP_AGL-2m#')

	console.log('Subscribed to queue:', QUEUE_NAME)

	// This will invoke a callback with each new message.
	// The url in the message object, along with the lat/long and weather attribute will be used to fetch the forecast data
	await ch.consume(QUEUE_NAME, async msg => {
		const [time, host, pathname] = msg.content.toString().split(' ')
		const url = host + pathname

		handleGrib2File(url)

		ch.ack(msg)
	})
}
Then, for each GRIB2 file notification event, we can make a request to our microservice:
async function handleGrib2File(url) {
  const response = await fetch(PYTHON_API, {
    method: 'POST',
    headers: {
      'Content-Type': 'application/json'
    },
    body: JSON.stringify({
      attribute: 't2m',
      queries: [
        {
          "lat": {{YOUR_LATITUDE}},
          "lon": {{YOUR_LONGITUDE}}
        }
      ],
      url: url
    })
  })

  const data = await response.json()

  console.log('Success:', data)
}
This will print the forecasted temperature data at the given latitude and longitude for every hour of each new forecast release!
Conclusions
MSC has various data formats, forecasting models, and even a Geomet API service that can also be helpful. Though HRDPS GRIB2 files are a fraction of the data they provide, we hope this can be used as a starting point for accessing public Canadian forecasting data. If you have any feedback or suggestions or questions feel free to send us an email.
If you're curious as to one of the ways we're using forecasting data, check out our latest tool: Beacon. It's an app built for folks that work out in heavily forested areas that uses weather data to calculate forest fire danger ratings and the corresponding work restrictions. Not only does Beacon display the current and historic danger ratings, but it also uses forecasted weather data to calculate what the danger rating may be 48 hours in the future. This helps workers make more informative decisions on whether it's safe to work or not and plan for upcoming shifts.
If you're interested in our work at Path and Focus, or have any feedback, questions, or suggestions, we'd love to hear from you! Get in touch and we'll see how we can help.